Top Ten 2022 KRG Hospitality Articles
by David Klemt
As we head into a promising new year of opportunities and growth, we want to take a look back at our most popular articles of 2022.
Before we jump in, we also want to thank you for your support. We greatly appreciate our readers, newsletter subscribers, clients, and partners.
Let’s all do what it takes to crush 2023!
US Senate Fails to Replenish the RRF
After conflicting reports and speculation, the US Senate has finally voted this week on replenishing the Restaurant Revitalization Fund.
Last week, multiple sources reported that the Senate would hold their RRF vote this week. Just days ago, several outlets sounded the alarm, reporting that the vote would be pushed to next week. The reason, these sources provided, was the Senate’s scramble to repackage and hold another vote on aid for Ukraine.
Senator Rand Paul (R-KY) blocked the bill that would provide $40 billion in defense and humanitarian aid. Unsurprisingly, it was also Sen. Paul who objected to $43 billion in emergency funding last August, killing that RRF replenishment effort.
Today, on the Senate floor, Sen. Paul repeatedly derided the replenishment of the RRF as a “bailout.” Additionally, he asked, “Where’s the emergency?”
So, one can infer that the impending closure of an estimated 50 percent of RRF applicants—88,500—isn’t an emergency to the Kentucky senator. Simple math shows that if each of those applicants has just ten employees, that’s a loss of 885,000 jobs.
Read this article in its entirety by clicking here.
SBA Releases 46% of Held RRF Funds
As it turns out, reports that the Government Accountability Office found $180 million in unspent Restaurant Revitalization Fund money were inaccurate. So, the $83 million the SBA disbursed before Thanksgiving was the entirety of the funds the GAO found.
This week, both the Small Business Administration and National Restaurant Association made statements about the release of $83 million in RRF funds.
“This week, the U.S. Small Business Administration (SBA) began distribution of returned funding in the Restaurant Revitalization Fund (RRF) program, following the program’s closure in June 2021. In doing so, the SBA worked with the advice of the Department of Justice on a plan to distribute the remaining funds, approximately $83 million,” reads a press release from the SBA.
“In addition to other SBA assistance programs, the RRF has helped more than 100,000 restaurants and other food and beverage business owners survive the pandemic,” continues the administration’s statement.
Click here to read this article in its entirety.
Hotels, Guest Data and Guest Expectations: A Chat with SevenRooms
People are eager to get back out there and hotels, of course, play a crucial role in their travel plans. However, we’re not engaging with the same guests we were pre-pandemic.
No, today’s guest demands more from the hotels and resorts they select. And a key to delivering on guest demands is collecting guest data.
But while operators know they’re supposed to be collecting guest data, there’s some uncertainty about what to actually do with it. Enter: SevenRooms.
More accurately, meet Austen Asadorian of SevenRooms. Not only can he address meeting guest demands through tech, he can address how to use guest data responsibly and effectively.
To read this article, please follow this link.
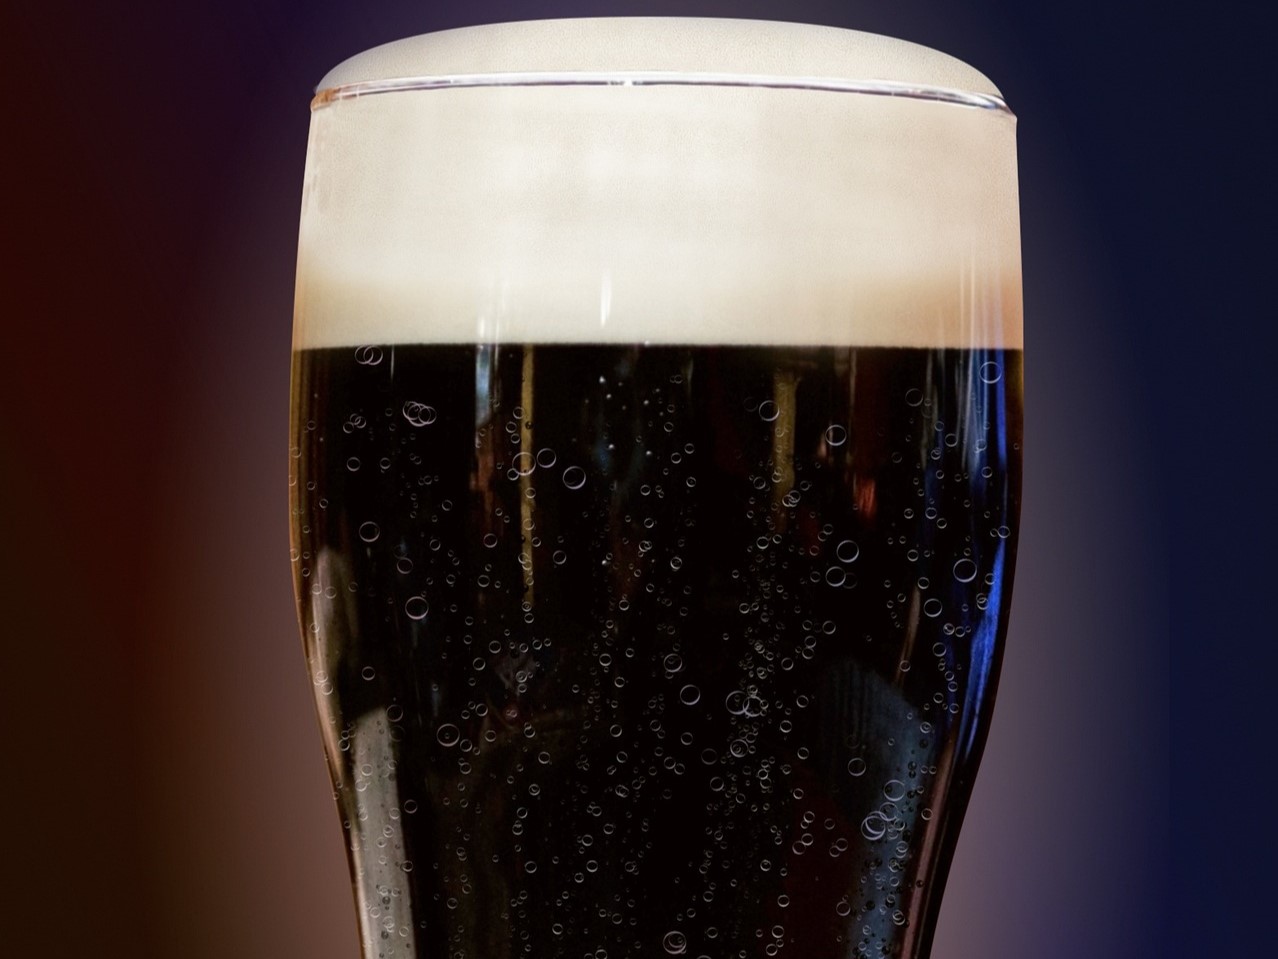
8 Glendalough Distillery Cocktail Recipes
Offer your guests something different for your St. Patrick’s Day promotion with Glendalough Distillery cocktail recipes.
Without a doubt, you should have plenty of the expected Irish whiskeys on hand. However, Glendalough Distillery Double Barrel, Pot Still, Wild Gin, and Rose Gin are extraordinary Irish whiskeys and gins.
Each spirit the distillery crafts honors the art of Irish distillation, a craft that stretches back centuries. What’s more, each whiskey Glendalough crafts is single malt—there are no light-bodied blends in their lineup.
To learn more, check out episode 71 of the Bar Hacks podcast with Glendalough Distillery co-founder and national brand ambassador Donal O’Gallachoir.
Sláinte!
Click here for these creative drink recipes.
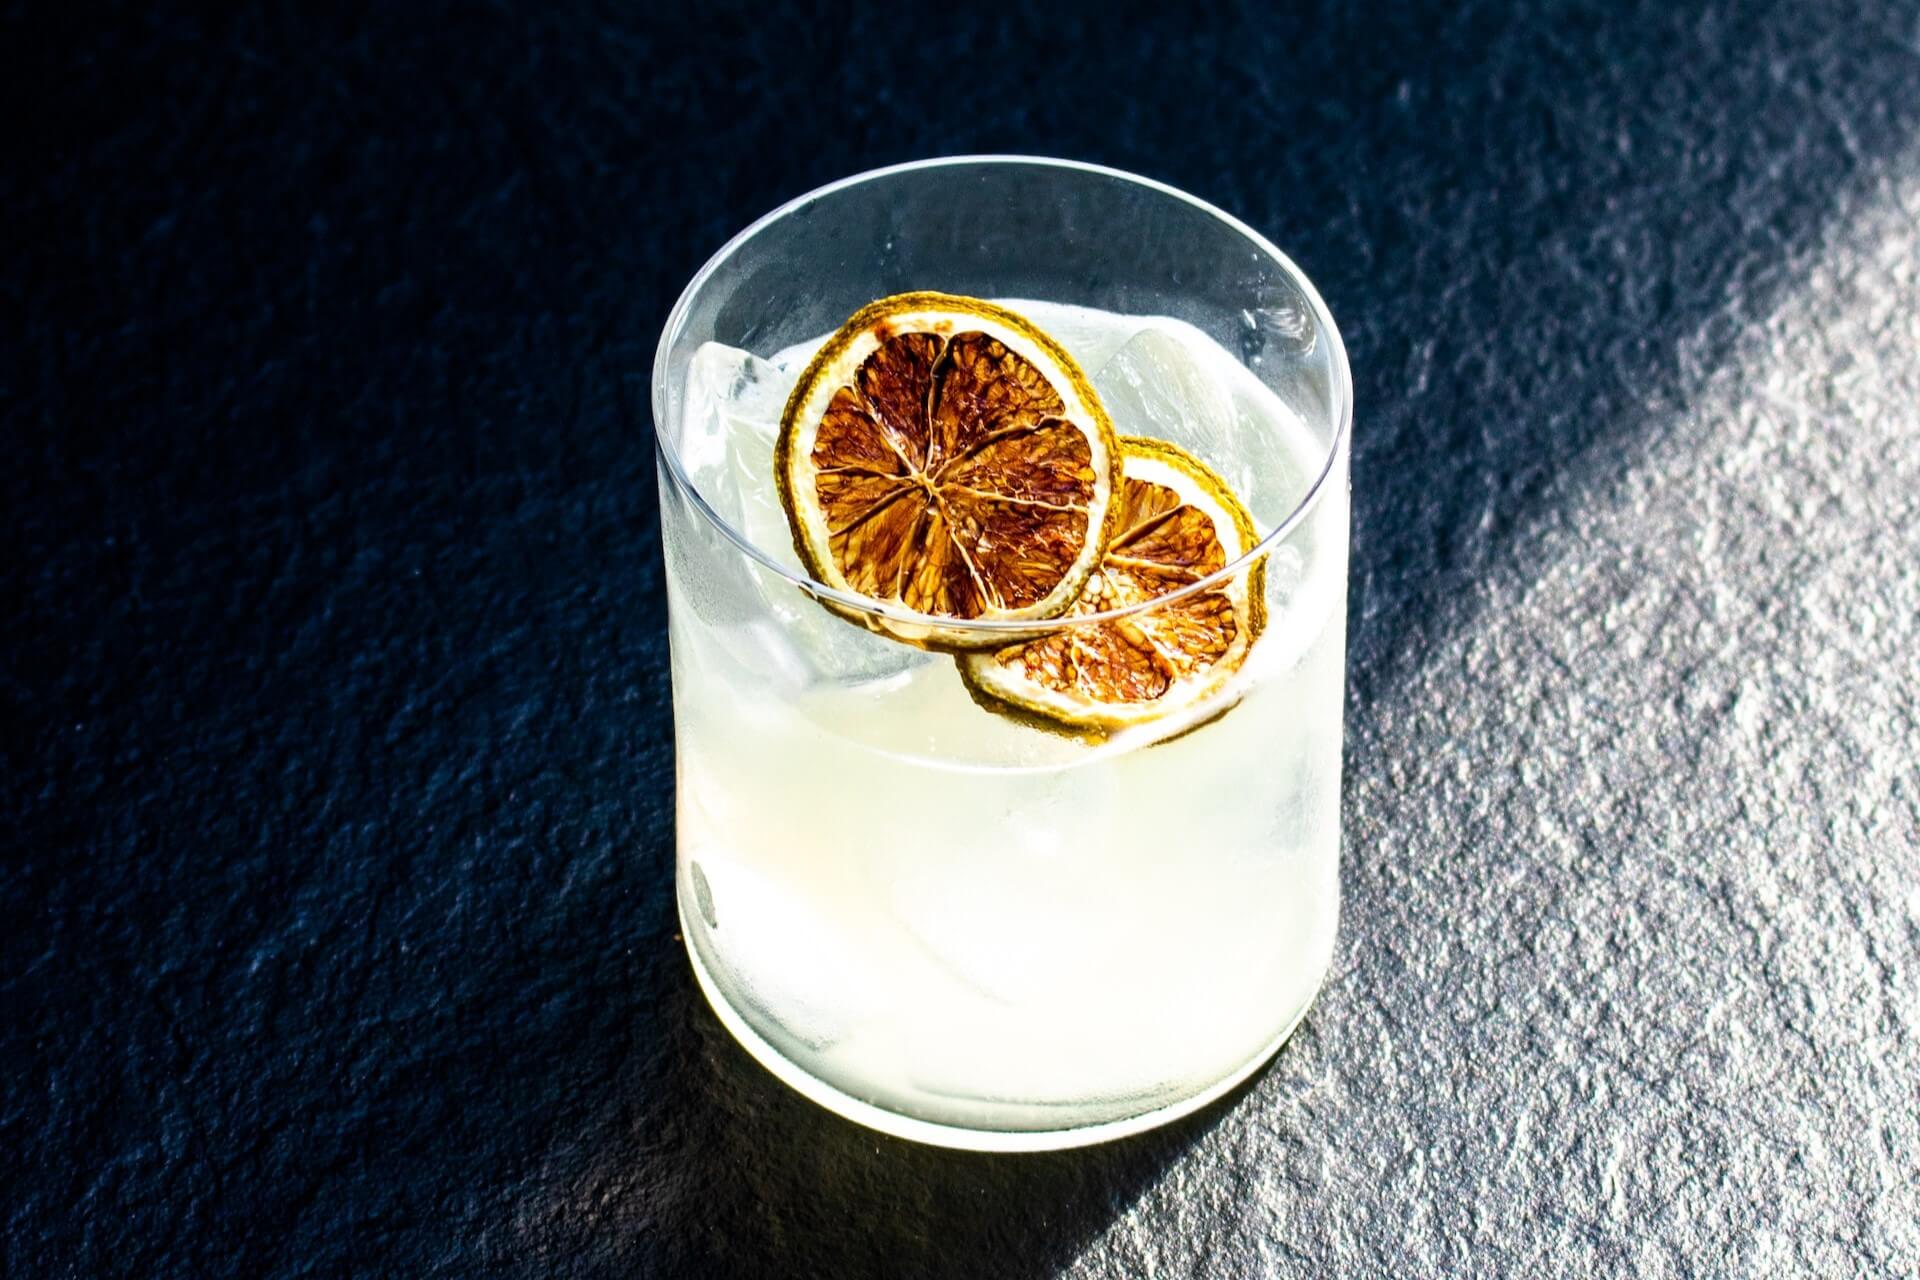
7 Coffee Liqueurs You Need to Know
Whether you and your bar team are making Espresso Martinis, riffing on classics or creating something new, consider these coffee liqueurs.
National Espresso Martini Day takes place on Tuesday, March 15. Leading up to this bar holiday, the cocktail is experiencing yet another resurgence.
In fact, this cocktail more than any other seems to maintain an enviable rate of “surging back” in popularity. Maybe it’s time to just admit that it’s a modern classic people love to hate…but still order and enjoy.
To learn which brands you need to know, click here.
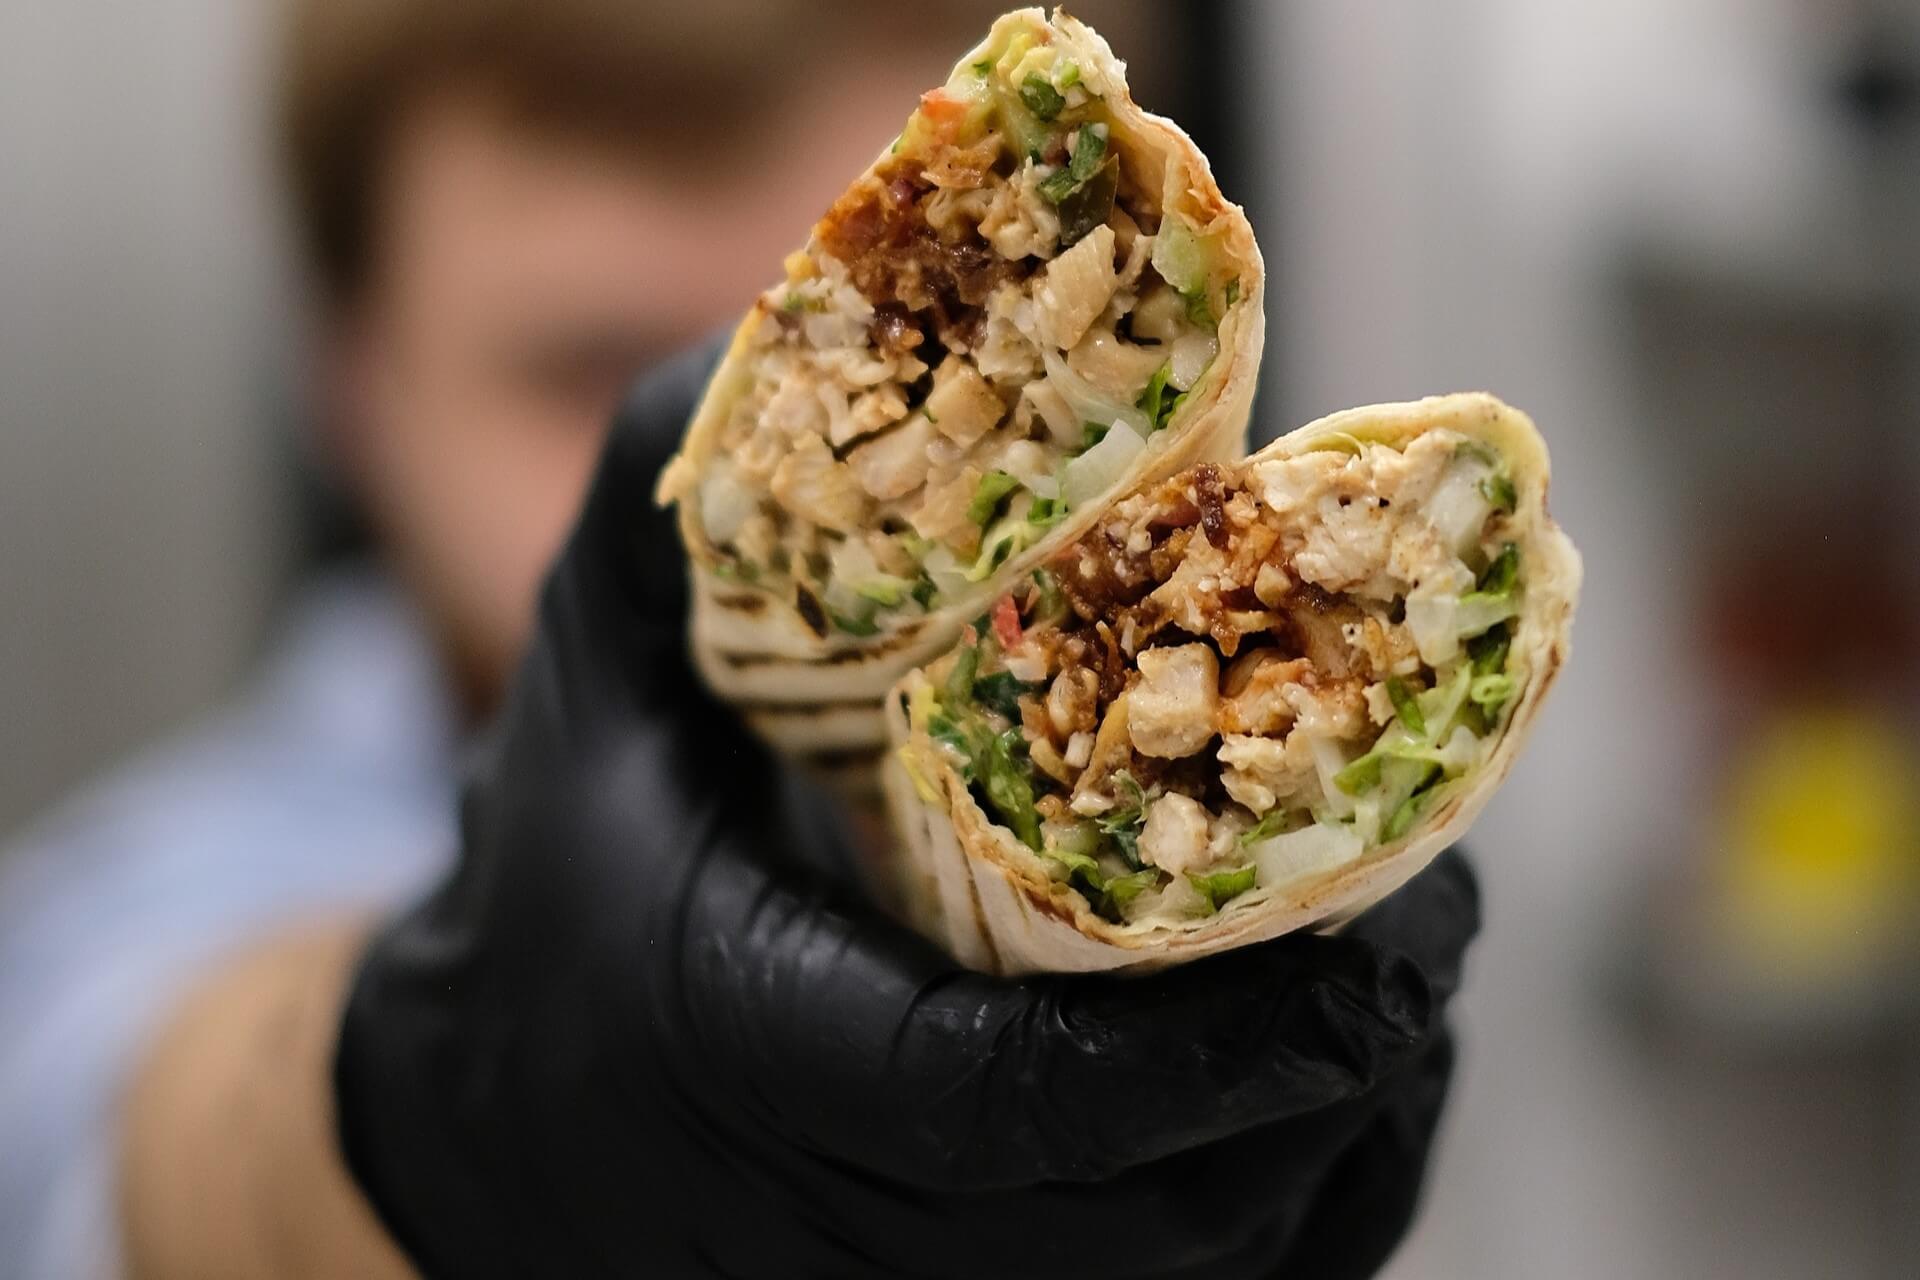
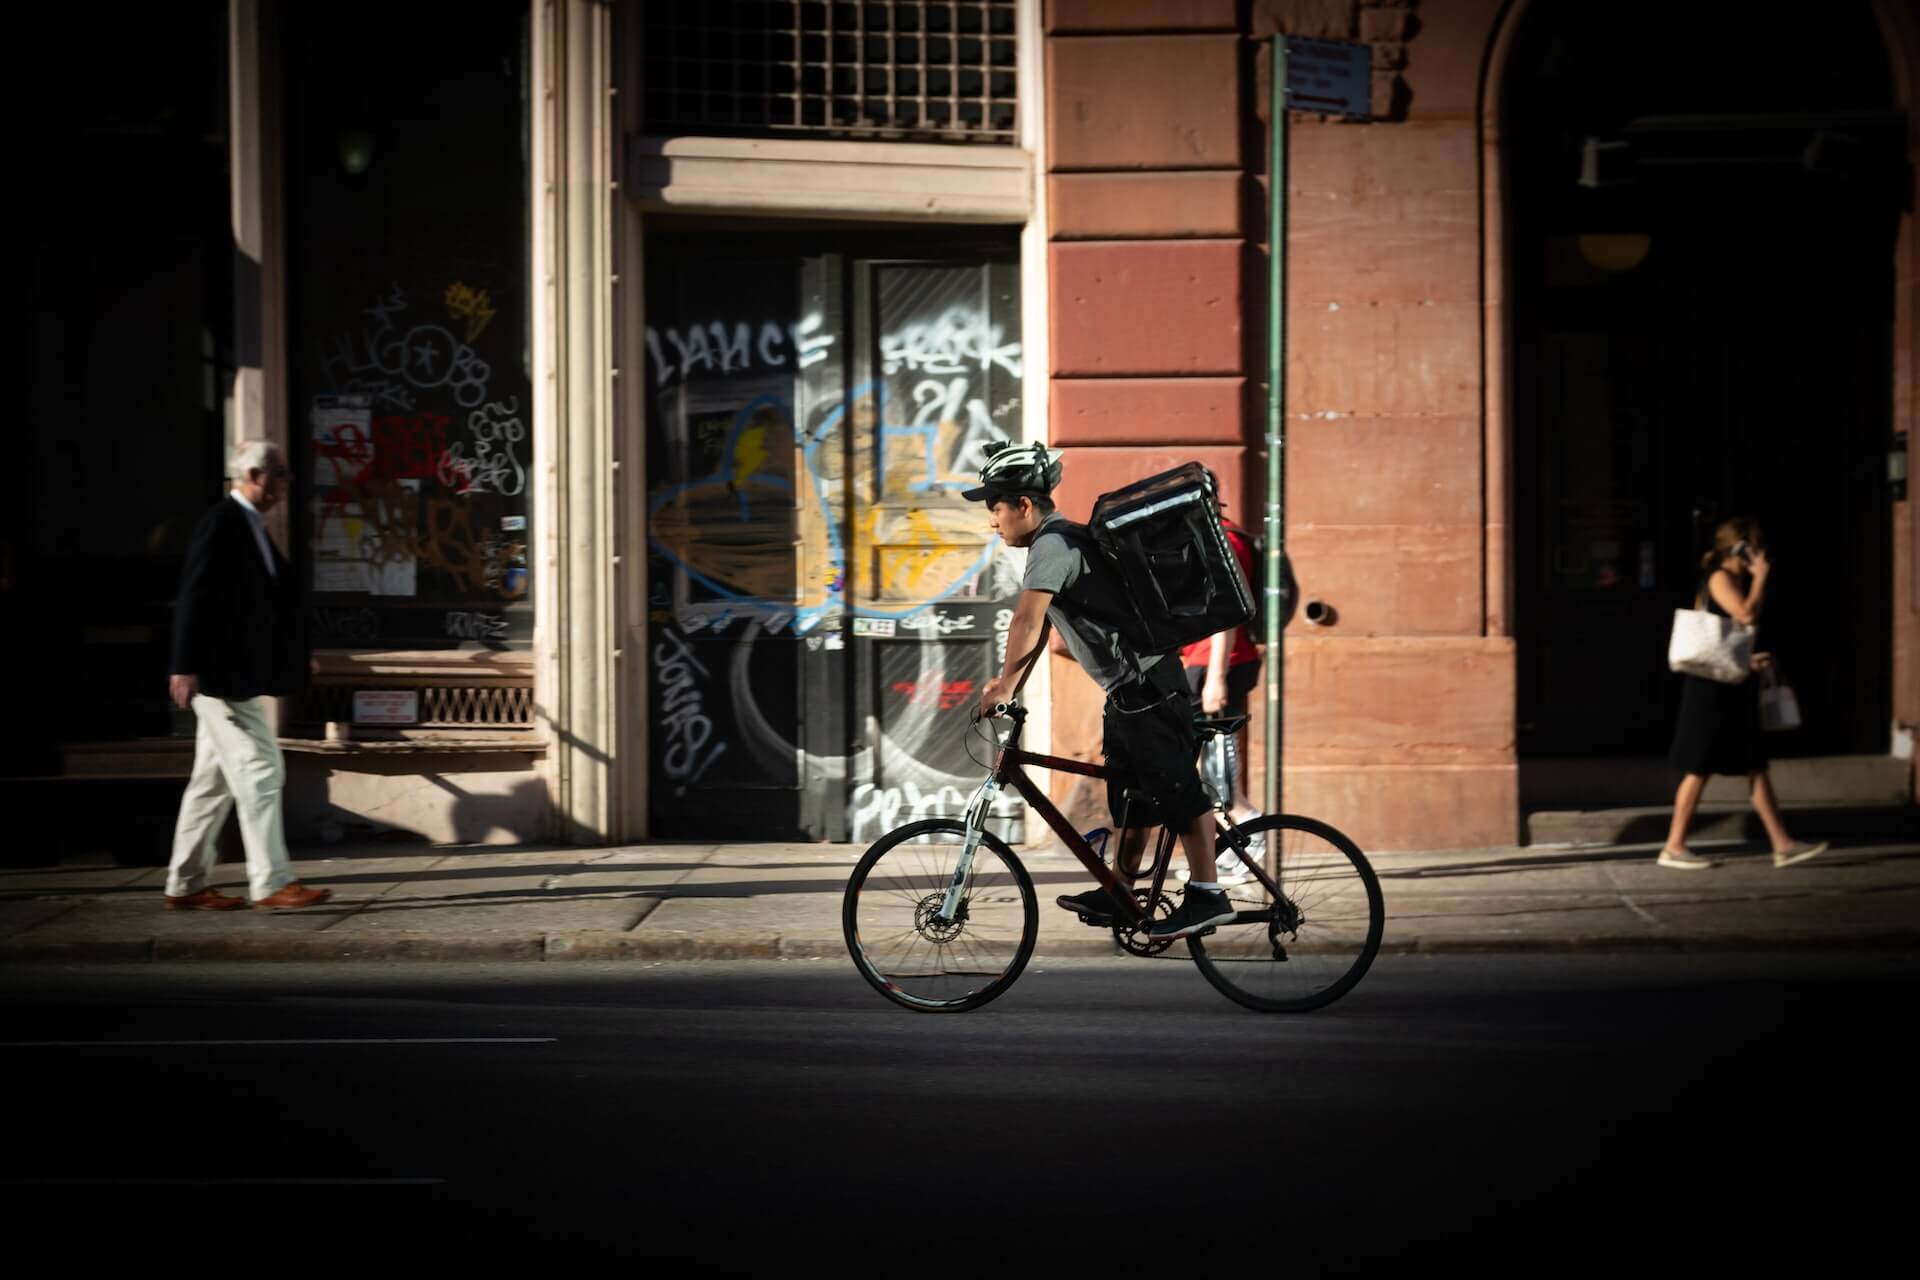
Delivery and Takeout Food Trends for 2021: Canada
Patrons, analysts and experts have spoken: delivery and takeout will remain standards in the new era of hospitality.
Analysts and experts have spoken with data, and consumers have spoken with their dollars.
But there’s another consequential voice that matters when it comes to delivery: that of the operator.
There’s no denying that the operator is shoved aside in the third-party delivery relationship. At the very least, that’s the overwhelming perception. Once an operator signs on with such a service, their guest data becomes the delivery company’s data.
Whatever company owns the data owns the guest, their journey and engagement, and the targeted marketing efforts. That means a restaurant or bar’s guests receive offers and promotions for their competitors.
In short, third-party delivery platforms disrupt the guest journey.
However, there are some data the third-party delivery services do share. As we saw midway through 2020, for example, Uber Eats and Grubhub released the top orders and other useful information in publicly available reports. Some of the services also release end-of-year or year-in-review reports, as SkipTheDishes did for Canada.
To read this article, follow this link.
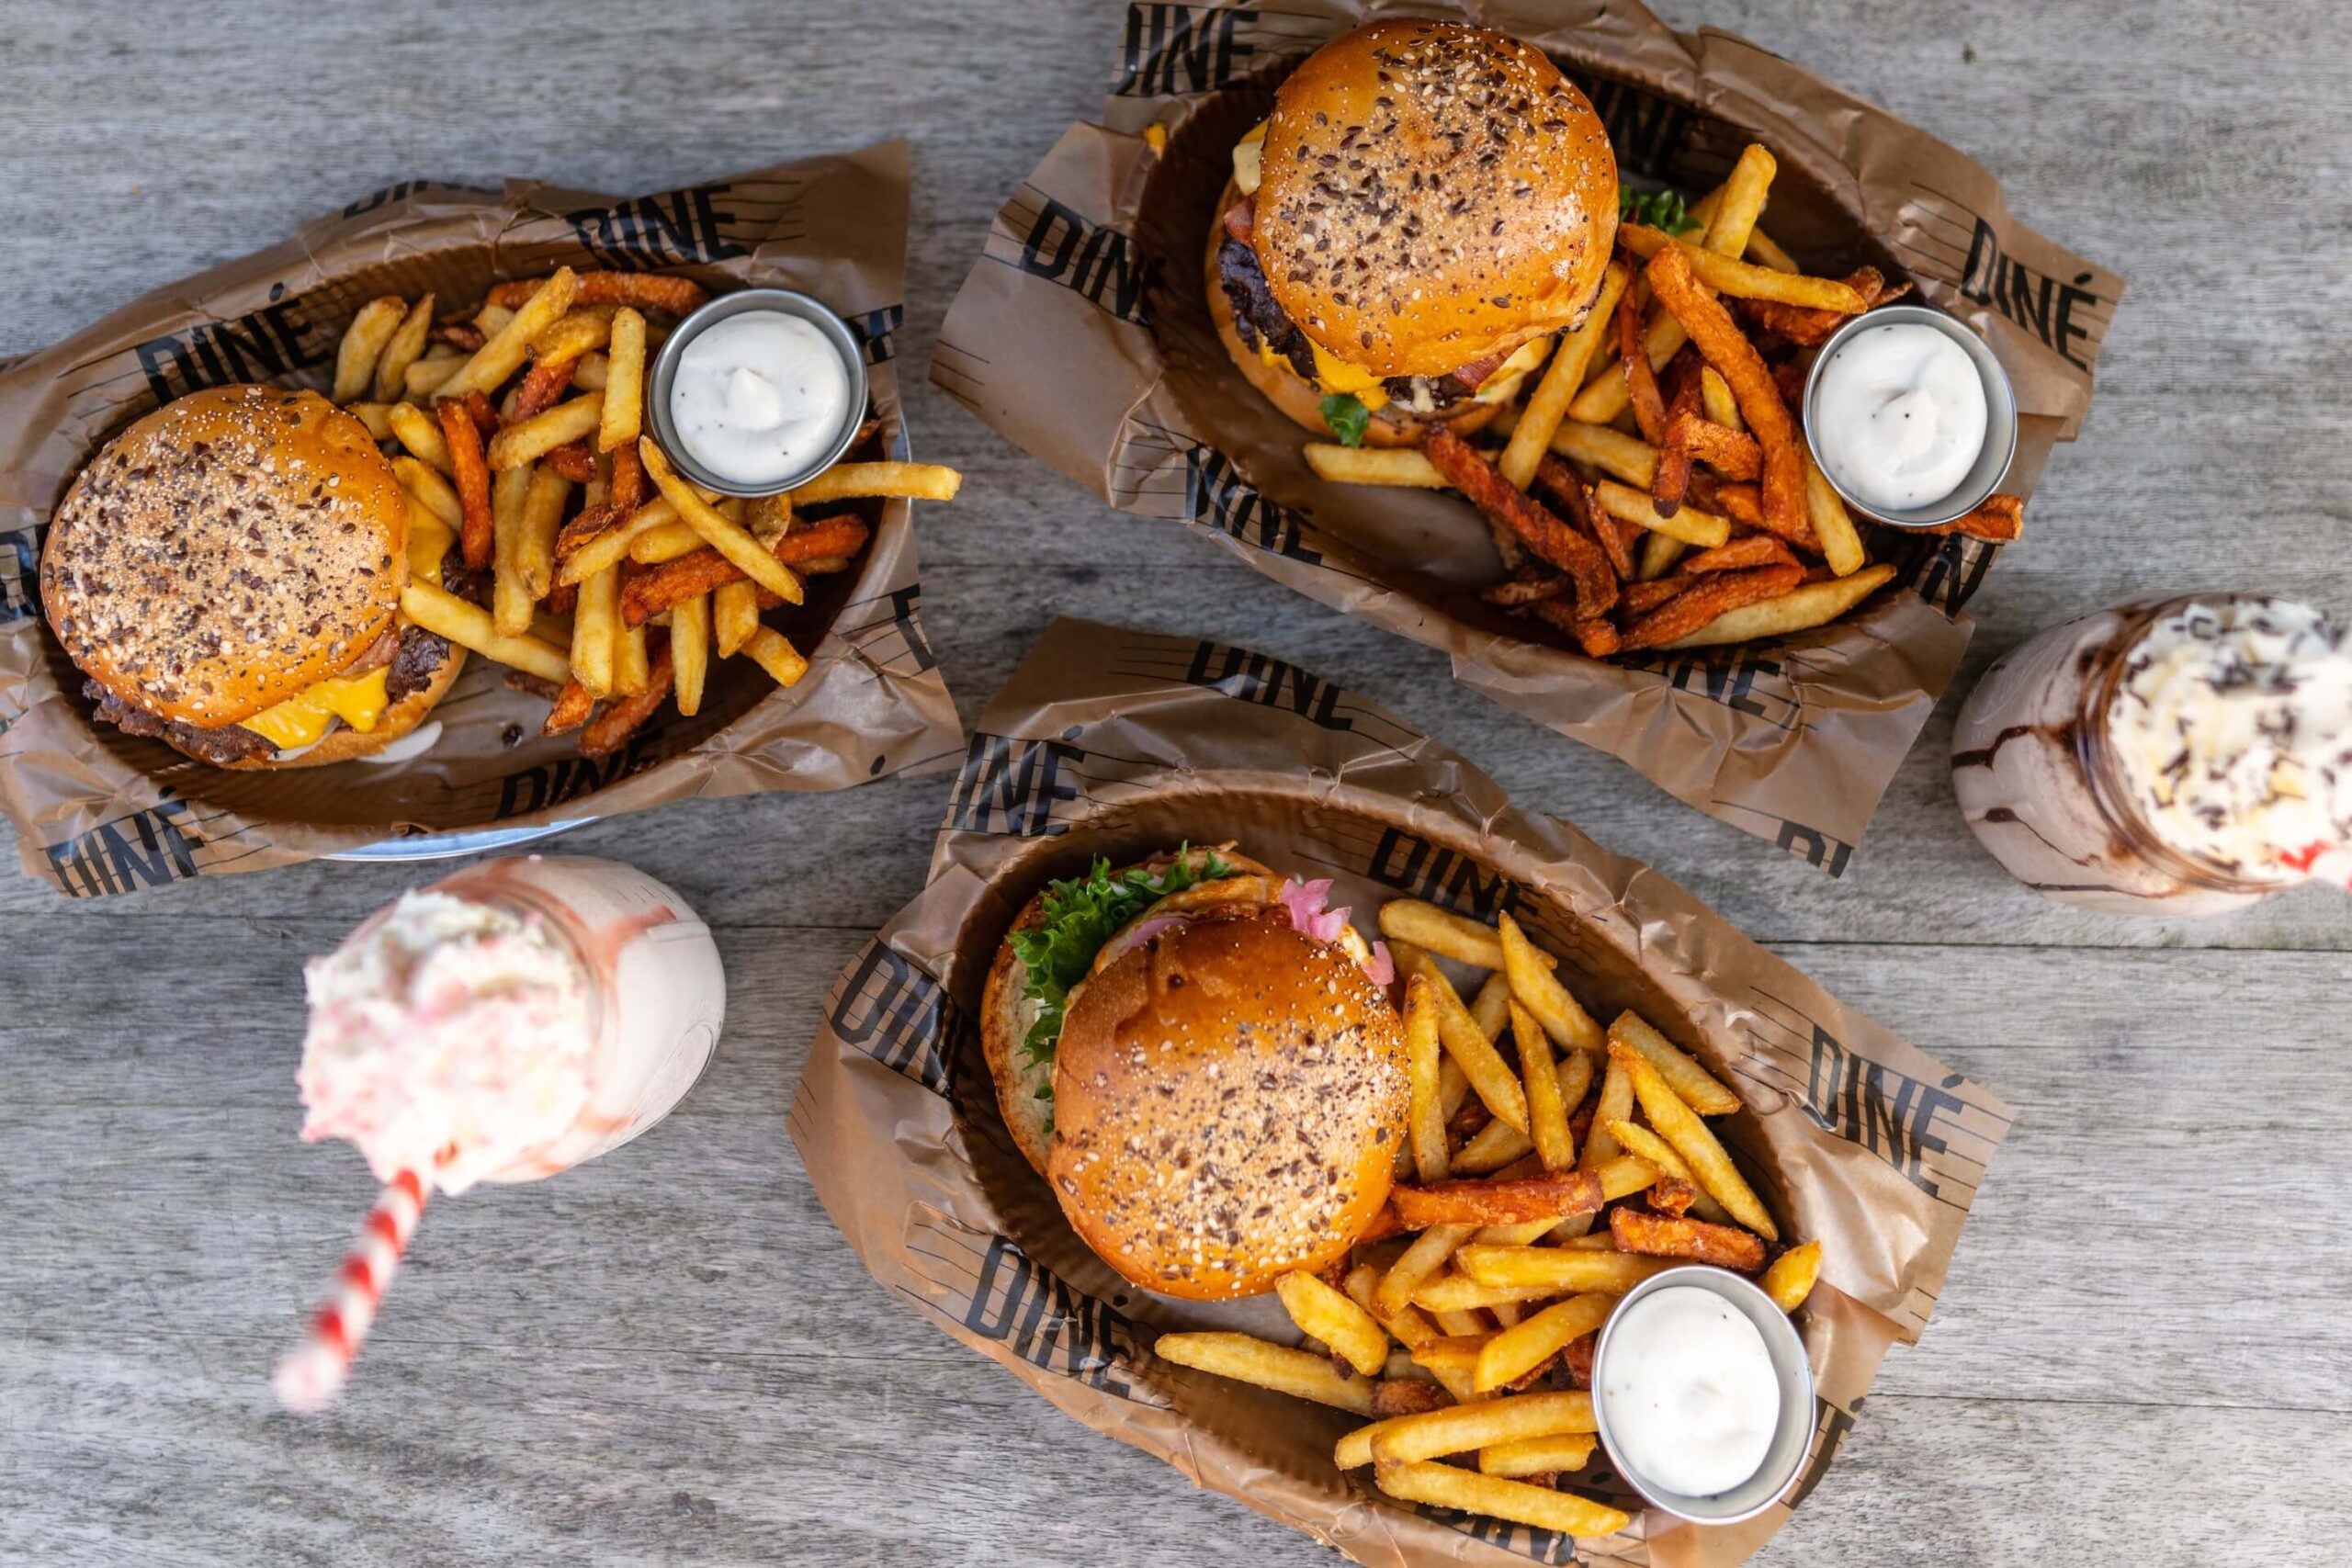
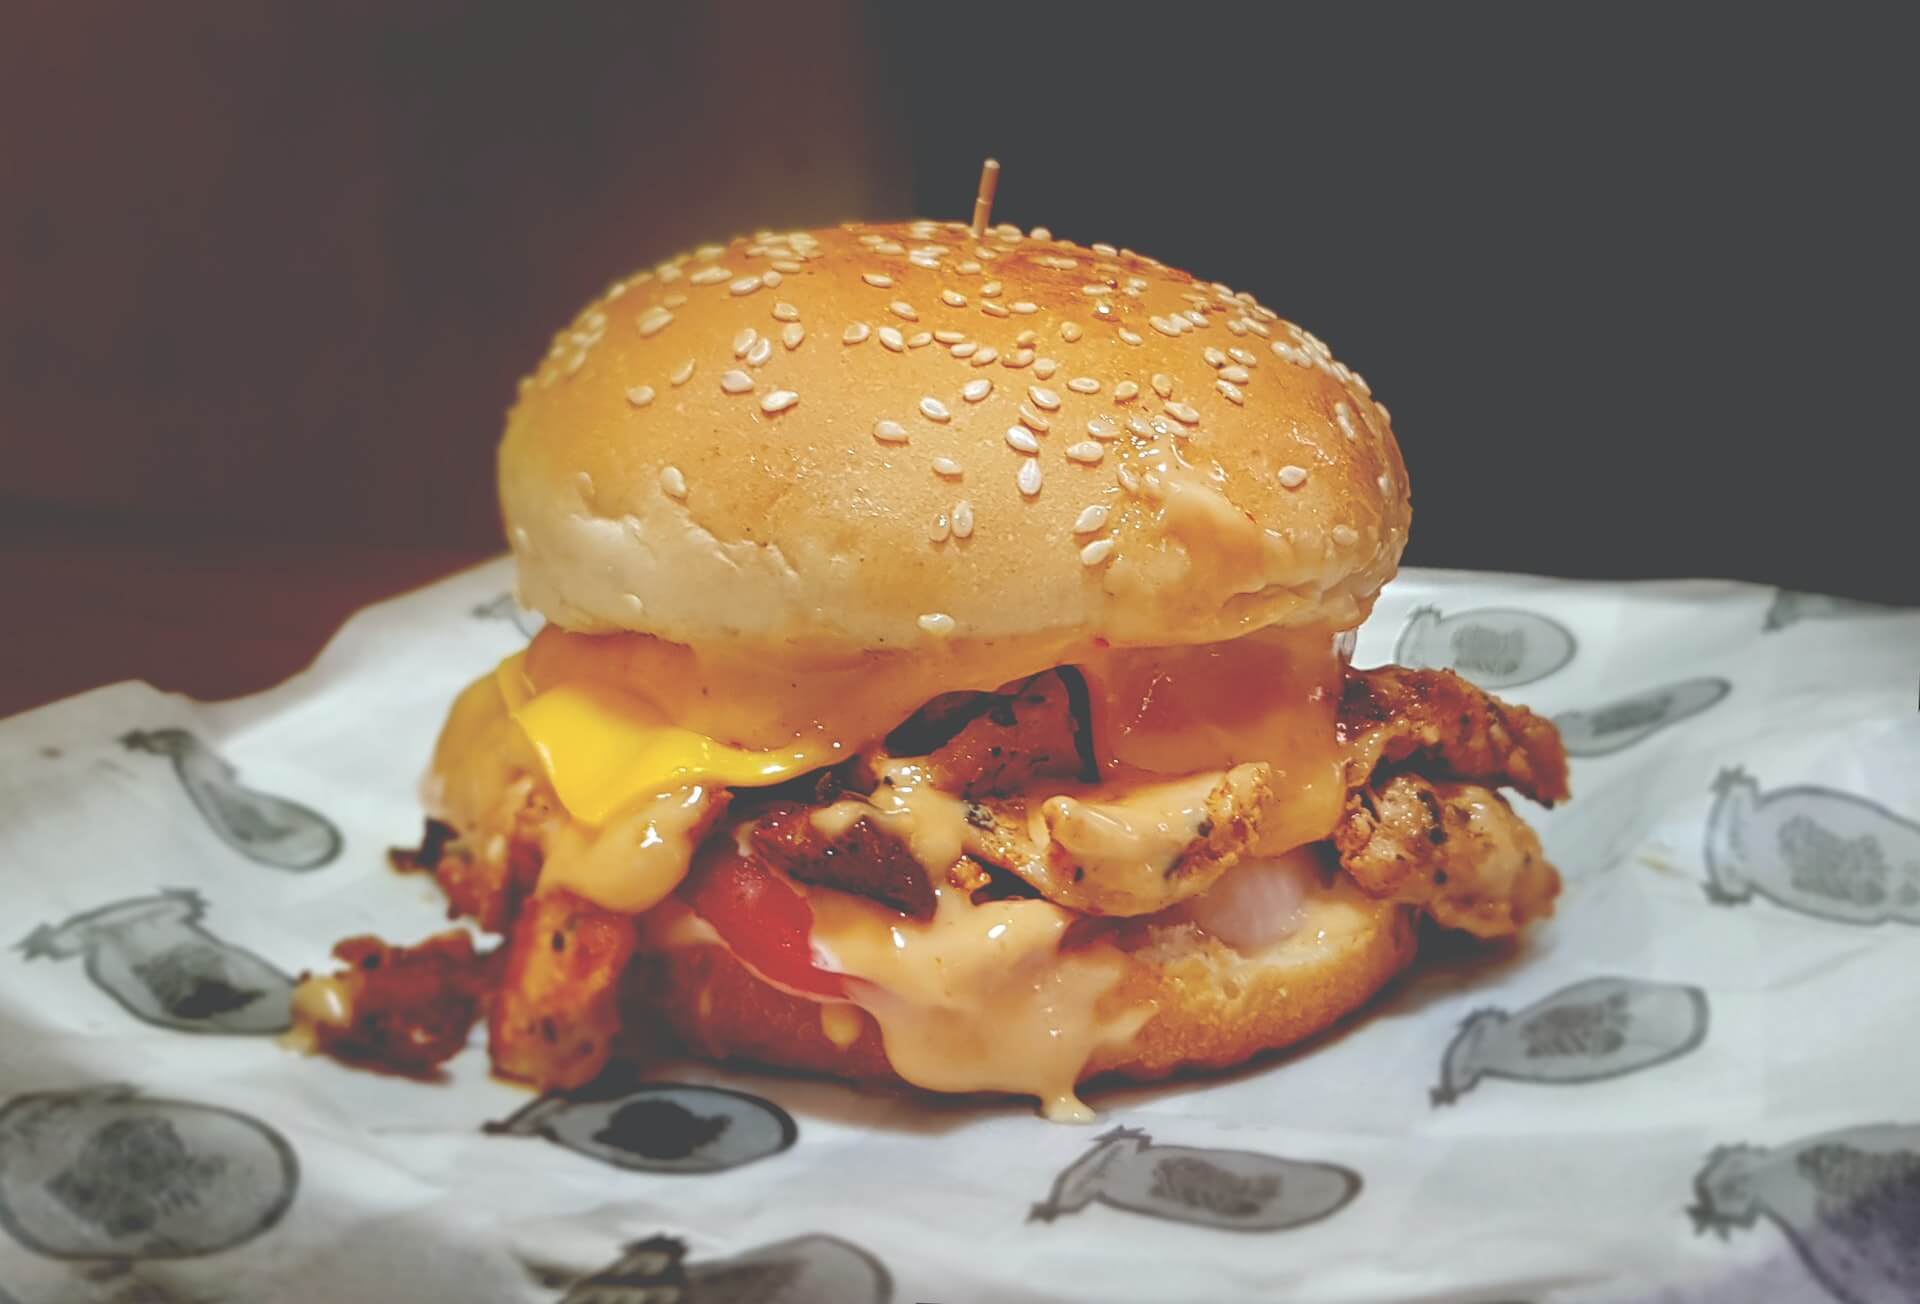
Container Kitchens: The New Footprint
In some cases, a smaller restaurant footprint is attractive to operators. This is due in part to guest behavior we’ve seen since 2020. That is, guests haven’t been able to or felt comfortable with dining indoors at restaurants.
Then, of course, there’s the cost factor. A smaller footprint, generally speaking, equals lower initial investment and rent. An operator with a new concept can use a container before investing in a brick-and-mortar location.
Other benefits relate to market testing; expansion; virtual and ghost kitchen operations; and delivery and pickup.
Operators looking to expand or add retail, along with QSRs, are showing interest in Make My Ghost Kitchen’s containers. One explanation for the interest is simple: containers are highly mobile.
An operator sends their kitted out container to a potential market. They open up shop and test the viability of their concept. If the reaction is less than desirable, they move the container to another market.
For example, one client set up a container complete with a delivery window. In just six hours they sold 3,600 burgers.
Learn more—click here.
How to Address Temporary Restaurant and Bar Closures: 5 Social Media Examples
There are a few reasons a F&B business will have to close due to the Covid-19 outbreak: official mandate, reduced indoor and outdoor dining capacities, and voluntary temporary closures.
Mandated closures are, on the surface, straightforward. Government officials decree that certain types of businesses must close their doors by a specific date and time, and owners are expected to comply.
Closures induced by capacity restrictions are less straightforward. It has become woefully apparent that most lawmakers don’t understand (or don’t care) that at a certain threshold, reducing indoor and outdoor dining capacities is as good as forcing a restaurant or bar to close; the value proposition of remaining open simply isn’t there.
A voluntary temporary closure can come about because of capacity limitations, but they can also be the result of other factors. A significant workforce reduction, lack of traffic, rising costs of goods, or an internal Covid infection.
The stark reality is that the likelihood today’s operators are going to have to craft social media posts and emails announcing temporary (and possibly extended) closures is anything but slim.
Click here for these social media messaging examples.
Developing a Bar Concept w/ Sensory Experiences
Owning a bar is a dream for most that must be met with the right research, planning, and mind-set.
One’s market will, and must, define the concept. To be successful, you must be open to building a venue the market both wants and needs.
Concept development is giving your ‘idea’, both soul and character. A bar’s concept is the lifeline of its brand and longevity in the market. It makes your venue stand apart from the competition, and it’s ultimately your bar’s unique selling proposition.
Have you ever walked into a bar and been confused about its identity? The interior doesn’t match the beverage offerings, the social media experience doesn’t reflect the actual experience, and even the music doesn’t seem to match the vibe of the bar.
This is what happens when there isn’t a clear and detailed concept development plan in place, and it is a sure fire way to be just average at best.
Read this article here.
Creating Restaurant Brand Ambassadors
Ask nearly every restaurant owner what their number one, long-term marketing ‘program’ or tactic is, and most will say effective word of mouth. This can be great until it starts to fizzle down or another new restaurant opens up down the street resulting in the competition becoming the new talk of the town.
Instead of shooting into the wind and hoping ‘word of mouth’ with deliver desirable long-term results, restaurateurs need to embrace a program that is an extension of word-of-mouth marketing, by developing what is called ‘brand ambassadors.’
A brand ambassador will positively represent and promote a restaurant’s venue. They will embrace the company values, vision, mission, and culture. They will strengthen a restaurant’s identity within the community by providing additional visibility and overall awareness.
Yes, word of mouth happens organically over time because of excellent food, drink, service, and experiences, don’t get me wrong. But what if there was a way to double-down and create multiple micro-communities and multiple levels of ambassadors to promote a restaurant’s brand?
That’s where an ambassador program comes in.
To read on, click here.
Image: George Pagan III on Unsplash